Sunday, June 10, 2012

Student Turns Math Homework Into Graduation Dress


I'm not sure what kind of grades she got in math, but I would give her an A+ in Creativity!


Instead of tossing her homework into the trash, one Canadian student fashioned the completed assignments into a graduation dress.

Kara Koskowich, 17, stitched about 75 pieces of math homework into a one-shoulder dress that captured the attention of friends and peers at her graduation ceremony, the CBC reports.

The dress is mostly white with a colorful belt made from neon Post-It notes.

Koskowich, who admitted the dress was finished just days before the reveal, said the papers were strategically placed to look like an explosion.
“For me, it's not a big, spend your money, you have to look this nice, you have to fit into this [mold] of grad,” Koskowich told the CBC.

Links:

CBC News Canada

Huffington Post

Wednesday, February 29, 2012

Your Brain On Dance


Scientists Map the Brain During Dancing

2/28/12

We can guess what our brains go through while we're dancing; we experience euphoria, elation, happiness, and probably nervousness for those with two left feet. While we're just conjecturing, scientists at Bangor University are discovering precisely what goes through the brain while we're shaking our groove thing. Dr. Emily Cross enlisted the help of contemporary dancer Riley Watts to examine how the brain responds to movement, both choreographed and improvised.
Watts told BBC, "I'm thrilled that my skills as a dancer can be put to use in a scientific context to further everyone's understanding of what is actually going on in our brains."
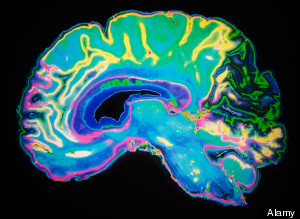
The contemporary dancer boogied in a variety of settings, including a 3D motion capture studio, and then had an MRI exam while he watched videos of himself. His brain's reactions were then recorded, giving us a window into the inner workings of our mind. Cross' focus is on the relatively new field of neuroaesthetics -- a field where the brain's reactions to artistic endeavors is studied -- creating the perfect opportunity to collaborate with Watts, who was thrilled to participate.
Cross sees even larger implications further down the road, saying,
"The material Riley and I develop will lead to experiments that advance our understanding of how the brain learns complex movement. In particular, our results will inform how therapists can best teach new motor skills to healthy people as well as those suffering from neurological or physical injury."

Source: Huffington Post

http://www.huffingtonpost.com/2012/02/28/scientists-map-the-brain-during-dance_n_1307017.html?ref=mindful-living&ir=Mindful%20Living

Tuesday, January 3, 2012

Map Making Marvels


The Piri Reis Map

The Greatest Paper Map of the United States You’ll Ever See - Made by One Guy in Oregon


The Imus Map
American mapmaking’s most prestigious honor is the “Best of Show” award at the annual competition of the Cartography and Geographic Information Society. The five most recent winners were all maps designed by large, well-known institutions: National Geographic (three times), the Central Intelligence Agency Cartography Center, and the U.S. Census Bureau. But earlier this year, the 38th annual Best of Show award went to a map created by Imus Geographics—which is basically one dude named David Imus working in a farmhouse outside Eugene, Ore.
At first glance, Imus’ “The Essential Geography of the United States of America” may look like any other U.S. wall map. It’s about 4 feet by 3 feet. It uses a standard, two-dimensional conic projection. It has place names. Political boundaries. Lakes, rivers, highways.

So what makes this map different from the Rand McNally version you can buy at a bookstore? Or from the dusty National Geographic pull-down mounted in your child’s elementary school classroom? Can one paper wall map really outshine all others—so definitively that it becomes award-worthy?

I’m here to tell you it can. This is a masterful map. And the secret is in its careful attention to design.
These days, almost all the data cartographers use is provided by the government and is freely available in the public domain. Anybody can download databases of highways, airports, and cities, and then slap a crude map together with the aid of a plotter. What separates a great map from a terrible one is choosing which data to use and how best to present it.
How will you signify elevation and forestation? How will you imply the hierarchy of city sizes? How big must a town (or an airport, or a body of water) be to warrant inclusion? And how will you convey all of this with a visual scheme that’s clean and attractive?
According to independent cartographers I spoke with, the big mapmaking corporations of the world employ type-positioning software, placing their map labels (names of cities, rivers, etc.) according to an algorithm. For example, preferred placement for city labels is generally to the upper right of the dot that indicates location. But if this spot is already occupied—by the label for a river, say, or by a state boundary line—the city label might be shifted over a few millimeters. Sometimes a town might get deleted entirely in favor of a highway shield or a time zone marker. The result is a rough draft of label placement, still in need of human refinement. Post-computer editing decisions are frequently outsourced—sometimes to India, where teams of cheap workers will hunt for obvious errors and messy label overlaps. The overall goal is often a quick and dirty turnaround, with cost and speed trumping excellence and elegance.
By contrast, David Imus worked alone on his map seven days a week for two full years. Nearly 6,000 hours in total. It would be prohibitively expensive just to outsource that much work. But Imus—a 35-year veteran of cartography who’s designed every kind of map for every kind of client—did it all by himself. He used a computer (not a pencil and paper), but absolutely nothing was left to computer-assisted happenstance. Imus spent eons tweaking label positions. Slaving over font types, kerning, letter thicknesses. Scrutinizing levels of blackness. It’s the kind of personal cartographic touch you might only find these days on the hand-illustrated ski-trail maps available at posh mountain resorts.
A few of his more significant design decisions: Your standard wall map will often paint the U.S. states different colors so their shapes are easily grasped. But Imus’ map uses thick lines to indicate state borders and reserves the color for more important purposes—green for denser forestation, yellow for population centers. Instead of hypsometric tinting (darker colors for lower elevations, lighter colors for higher altitudes), Imus uses relief shading for a more natural portrait of U.S. terrain.

Read more & see examples of why the Imus map is so much better here...